Each year, we publish a report summarizing the current state of K-12 computer science education in the United States in partnership with the Code.org Advocacy Coalition and ECEP Alliance. The 2024 report is now available at https://advocacy.code.org/stateofcs.
Celebrating Progress
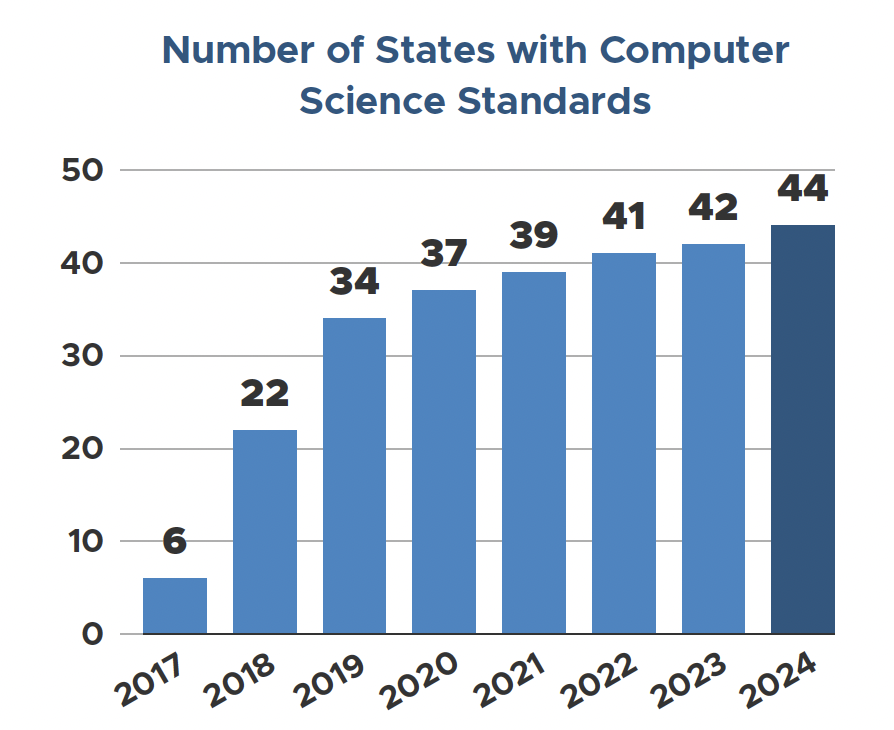
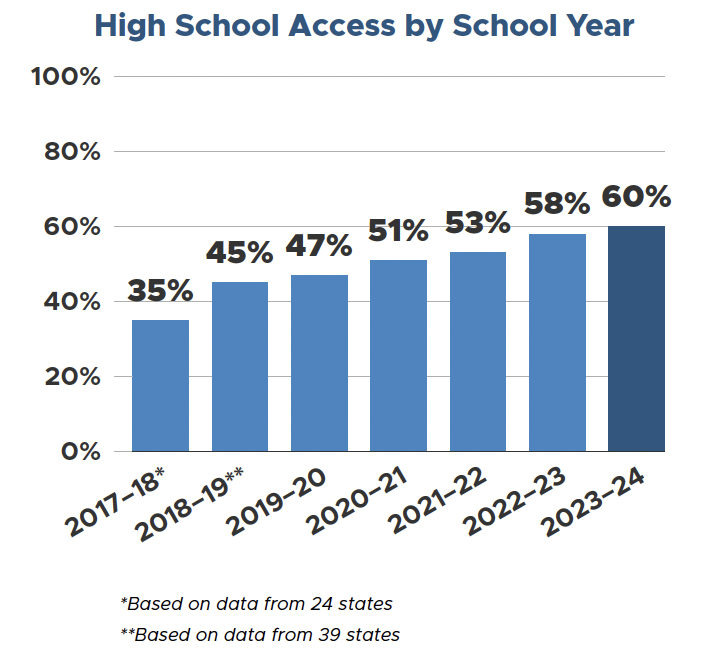
This report chronicles some incredible progress towards our vision of “every student prepared for a world powered by computing” over the last eight years. While only six states adopted K-12 CS standards in 2017, nearly all states now have CS standards. Policies such as this have supported huge growth in the availability and participation in CS classes. In fact, nearly twice as many high schools offered CS in 2023-24 as they did in 2017-18, and 82% of U.S. high school students now have CS classes available at their schools.
More students are learning CS than ever before. Approximately 6.4% of high school students take computer science classes annually. To achieve our vision, this needs to grow to 25%, so that all students can learn CS before they graduate from high school. Fortunately, a higher percentage of middle and elementary students are enrolled in CS annually (8.3% and 13%, respectively), though we also know this undercounts because we lack data from many states and are currently unable to consider integration outside of CS course offerings. Across the board, we still have a long way to go to reach all – and even the majority of – students.
Illuminating Disparities
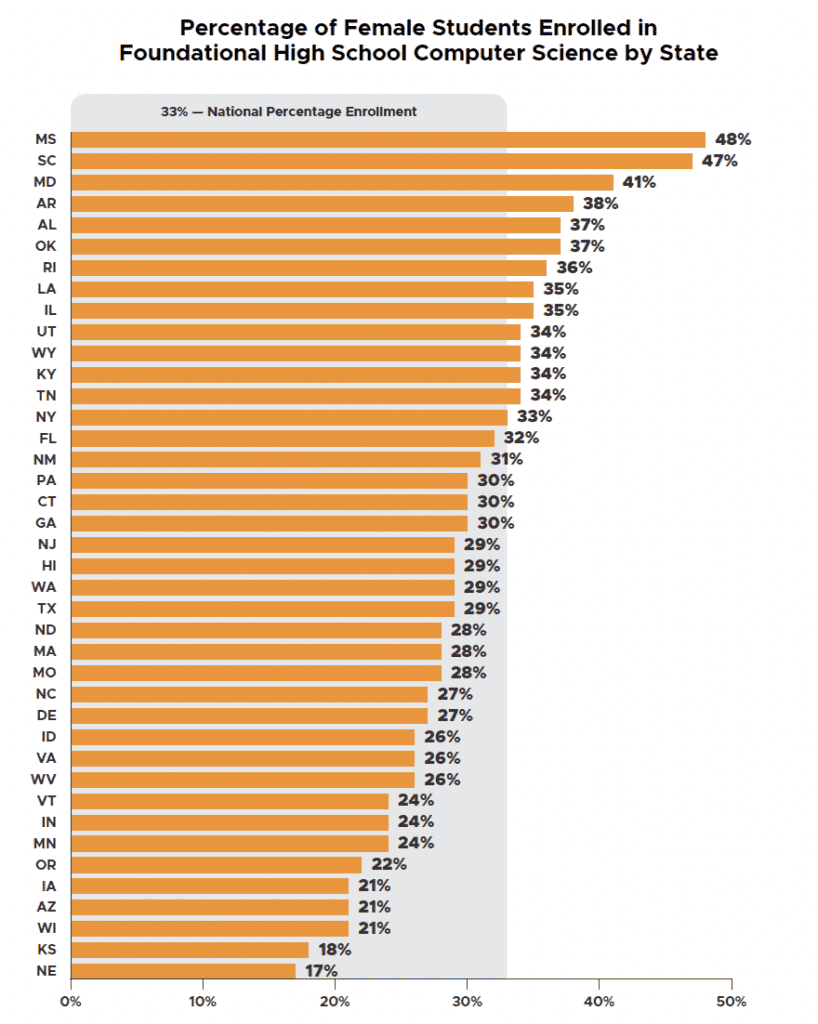
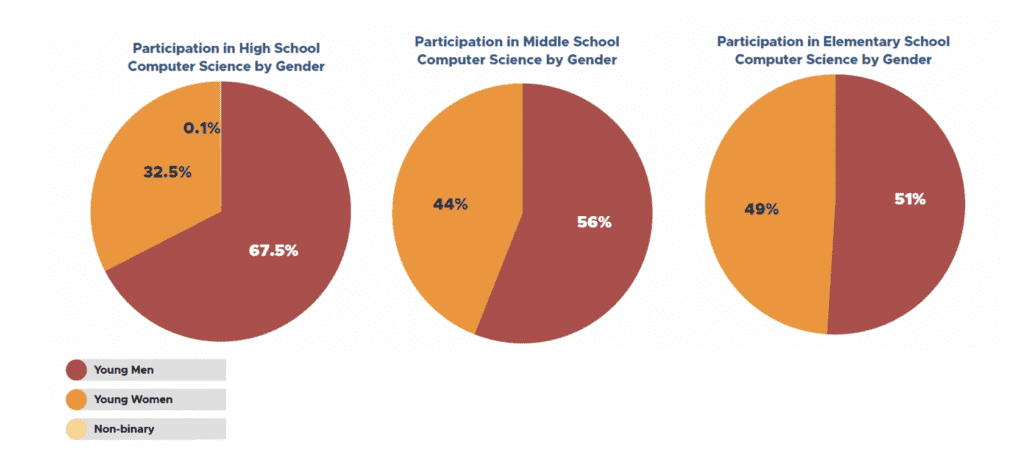
This report also illuminates some troubling and persistent disparities in who learns CS. In particular, young women are significantly underrepresented, comprising only about 33% of all high school students in CS. Despite significant movement in policy, this percentage has remained mostly consistent (between 31-33%) over the last several years. However, gender participation ranges widely by state, as shown in the chart below. The greatest gender parity is seen in states that have adopted CS graduation requirements. And fortunately, we see significantly higher participation in middle and elementary grades (44% and 49%, respectively).
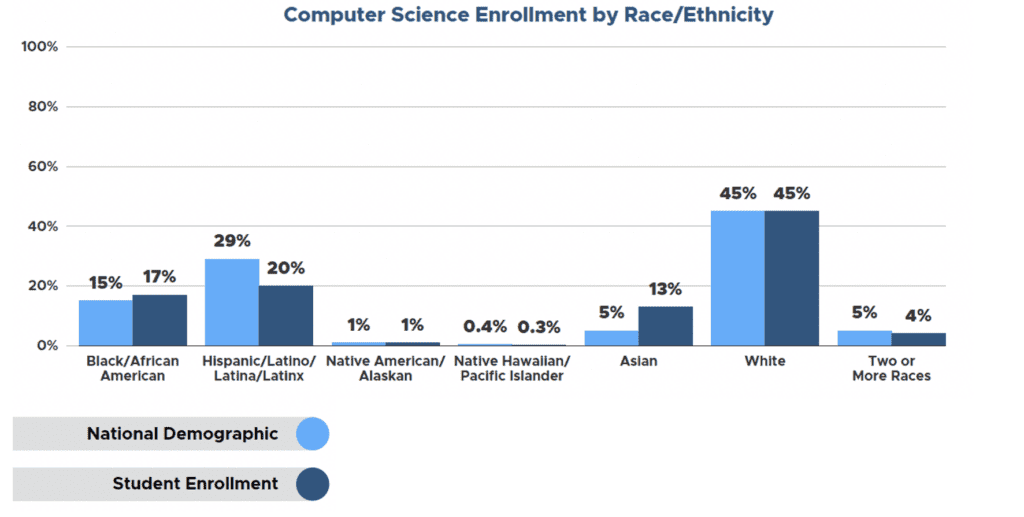
Another persistent disparity impacts Latine students taking CS classes. The chart below compares national demographics of high school students (light blue, left), as compared with their participation in CS (dark blue, right). Latine students are the most underrepresented group, making up 20% of CS participation but 29% of school enrollment. Most other racial and ethnic groups are at or near parity. In fact, this was the first year that Native American/Alaskan students are proportionally represented in high school CS.
There are other inequities beyond gender and race. For example, we continue to see lesser participation in CS among socioeconomically disadvantaged students (38% in CS, but 53% in schools), multilingual learners (7% in CS, but 11% in schools), and students with disabilities (10% in CS have IEPs, but 15% in schools have IEPs).

Classroom Experience
We know that teachers’ instruction and inclusive classroom environments are what actually matters for ensuring student success. We currently have little systematic data describing students’ experience in CS, such as their achievement and feelings of inclusion. However, we report some stories and ideas about what is happening in the classroom, celebrating many teachers across the U.S.
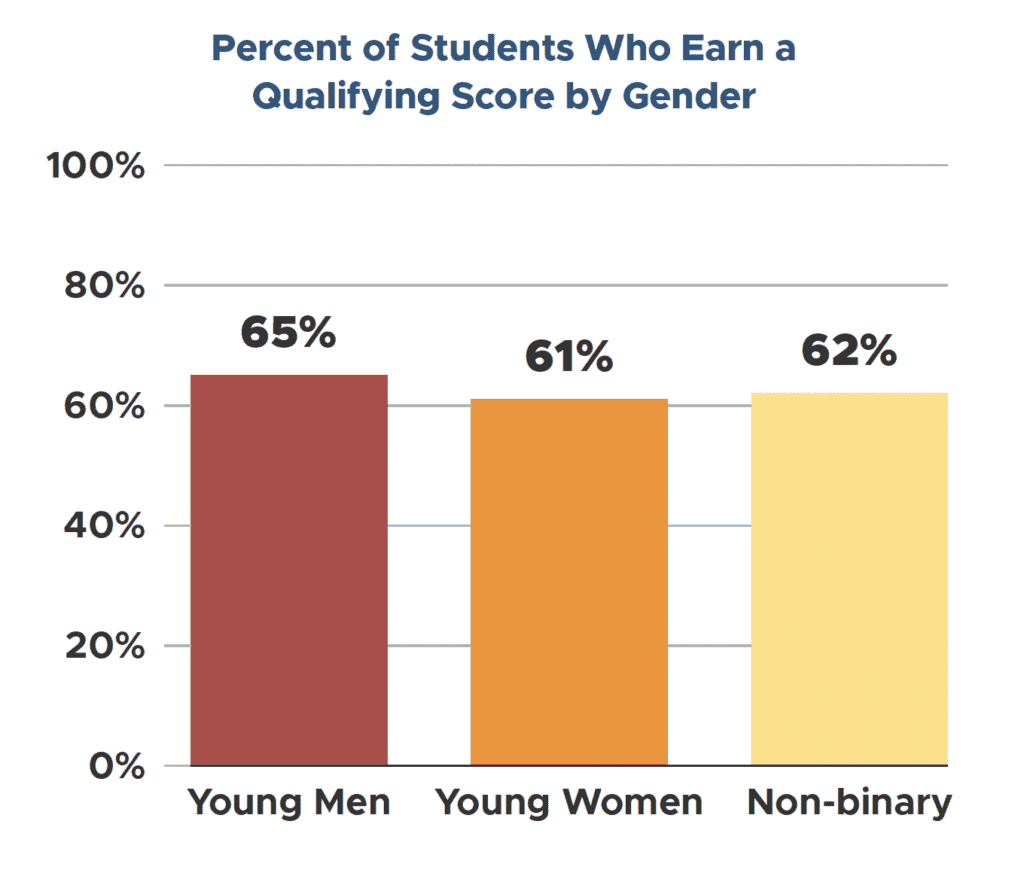
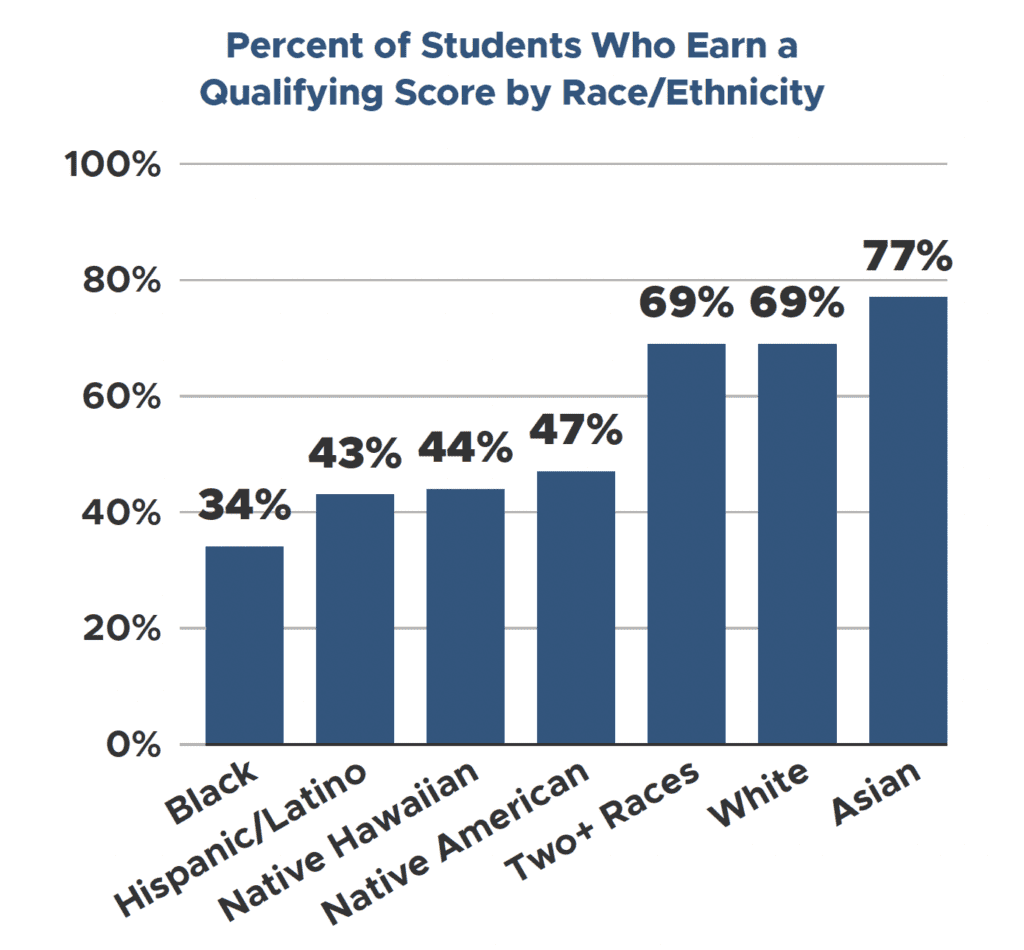
Additionally (with thanks to our CSTA Data Analyst and longtime CSTA Paso del Norte Chapter Leader, Cat Tabor), we present achievement data for the first time. In AP CS exams, young women are significantly underrepresented, but they earn qualifying scores at a similar rate as young men. Unfortunately, the same is not true across race and ethnicity, where we see significant inequities. (See the table below showing the percentage of students who earn a score of 3 or above by race/ethnicity).
Thanks to CS Teachers
There is a lot more information in the report, which I encourage you to read and share. And, in addition to policy shifts, we know that much of our forward progress is because of the tireless efforts of teachers who are advocating to expand CS and disrupt inequities. While this is not part of teachers’ responsibilities, it is such important work. Thank you, thank you, thank you! 🫶
Please join us for a webinar at 6 p.m. ET on Thursday, Oct. 24, where we will not only summarize trends from the report but also focus on teacher advocacy. Members of the CSTA Policy Committee will present their advocacy toolkit and how you can help promote CS in your state and local community. Register here.